
Survey System - Capviaggi
Automated feedback collection system for tour operators managing over 10,000 passengers annually, integrating AI sentiment analysis and dashboard analytics to transform scattered data into actionable strategic insights.
- Client:
- Cap Viaggi
- Year:
- 2026
- Industry:
- Travel
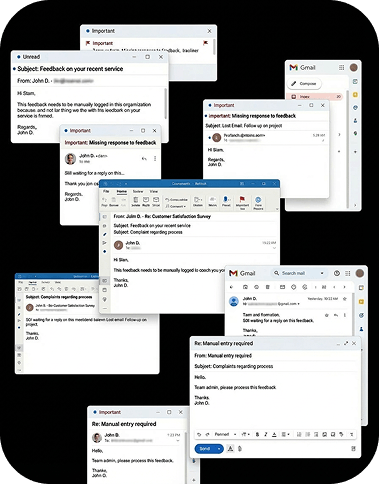
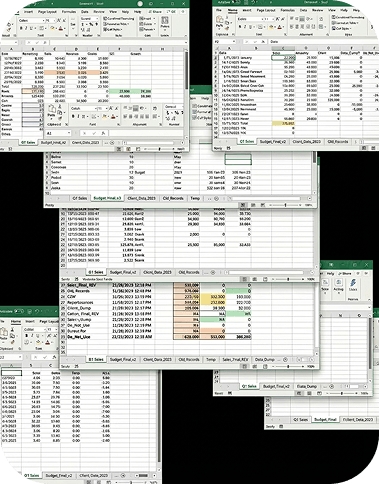
The challenge of manual feedback management
CapViaggi handles over 10,000 passengers annually through organised tours across Italy and abroad. The feedback collection process used to require days of manual work: paper questionnaires filled out during trips (often lost or illegible), emails sent individually by the admin team, and data scattered across Excel files that were impossible to analyse systematically. Management spent days reading hundreds of feedback entries and compiling summary reports, basing strategic decisions on subjective impressions rather than structured data. The company couldn't identify recurring patterns or systemic issues in a timely manner, missing improvement opportunities and risking impacts on public ratings.
An integrated system for end-to-end automation
We designed a solution that connects natively to the Zucchetti management system already in use, completely eliminating manual data entry and transcription errors.

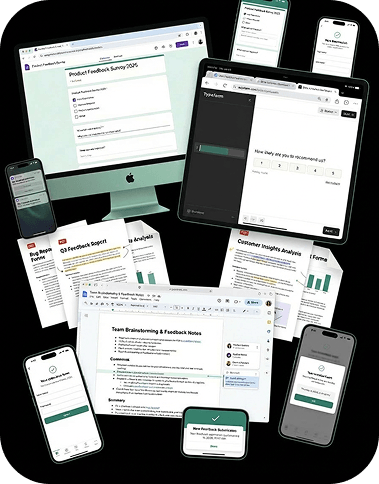
Automated and personalised surveys
The system monitors the database and automatically sends mobile-optimised surveys 48 hours after return. Questions dynamically adapt to the tour type (beach vs mountain, domestic vs international, food & wine vs cultural), achieving an 82% completion rate with an average time of 3.5 minutes per questionnaire.

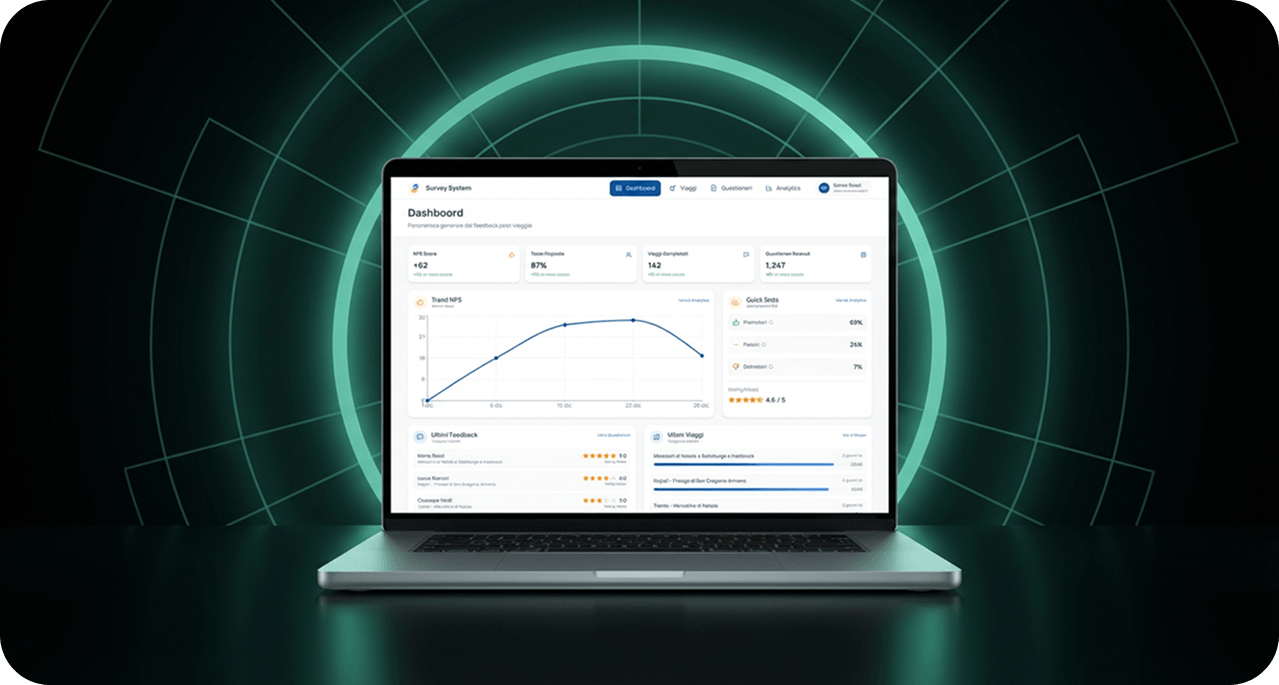
Multi-level analytics dashboard
The platform collects feedback from both passengers and tour leaders, offering a 360-degree view of trip quality. Analytics include KPIs per individual trip, cluster analysis across trip groups, and granular breakdowns by service category with automated scoring.
AI-powered sentiment analysis on open feedback
Artificial intelligence automatically analyses text comments, identifies recurring themes, and distinguishes systemic issues from isolated incidents. The system generates alerts when a negative pattern emerges, enabling preventive rather than reactive interventions.
Stack tecnologico
React + TypeScript
Modern, fast, and type-safe dashboard.
TailwindCSS + Radix UI
Responsive UI with accessible components.
NestJS
Modular backend with ORM for structured data management.
MySQL + MSSQL
Dual database for survey data and Zucchetti integration.
Results and impact
- 85% reduction in analysis time (from 3-4 days to 20 minutes)
- Full automation for 10,000+ passengers annually with zero administrative overhead
- Completion rate increase from 31% to 82% compared to traditional methods
- Proactive identification of 3 systemic issues resolved before impacting public ratings
- Data-driven decision-making with actionable weekly insights
Let's talk now.
More projects, more stories
Discover more projects that showcase our approach.

